Monitoring Dashboard
LogEverything includes a web-based monitoring dashboard for exploring logs, operations, and system metrics collected by the monitoring subsystem.
Getting Started
Prerequisites: Python 3.8+ and a data directory containing the SQLite
database (monitoring.db) and/or JSONL log files produced by LogEverything’s
monitoring subsystem.
cd logeverything-dashboard
pip install -r requirements.txt
python run_dashboard.py
# Dashboard opens at http://localhost:3001
The startup script compiles SCSS, launches a file-watcher for live style reloading, and starts the Uvicorn server.
Connecting to Data
On first launch a Default Connection pointing at ../sample_monitoring_data
is created. To connect to your own data:
Click the link icon in the sidebar footer.
Choose Local (file path) or API (remote endpoint).
Provide the path to the directory containing
monitoring.dband/or*.jsonllog files.Click Test Connection, then Save.
Note
Local connections automatically discover both active log files (*.jsonl)
and rotated files (*.jsonl.*, including gzipped archives). No extra
configuration is needed — point the connection at your data directory and
all matching files are read.
Layout
The dashboard uses a multi-page layout with a fixed sidebar and a header bar.
Sidebar (left, 240 px) — Navigation links, connection status, version. The active page is highlighted. Collapses on viewports narrower than 1024 px and can be toggled with the hamburger icon.
Header (top) — Time-range selector, auto-refresh toggle, export button, and theme toggle.
Pages
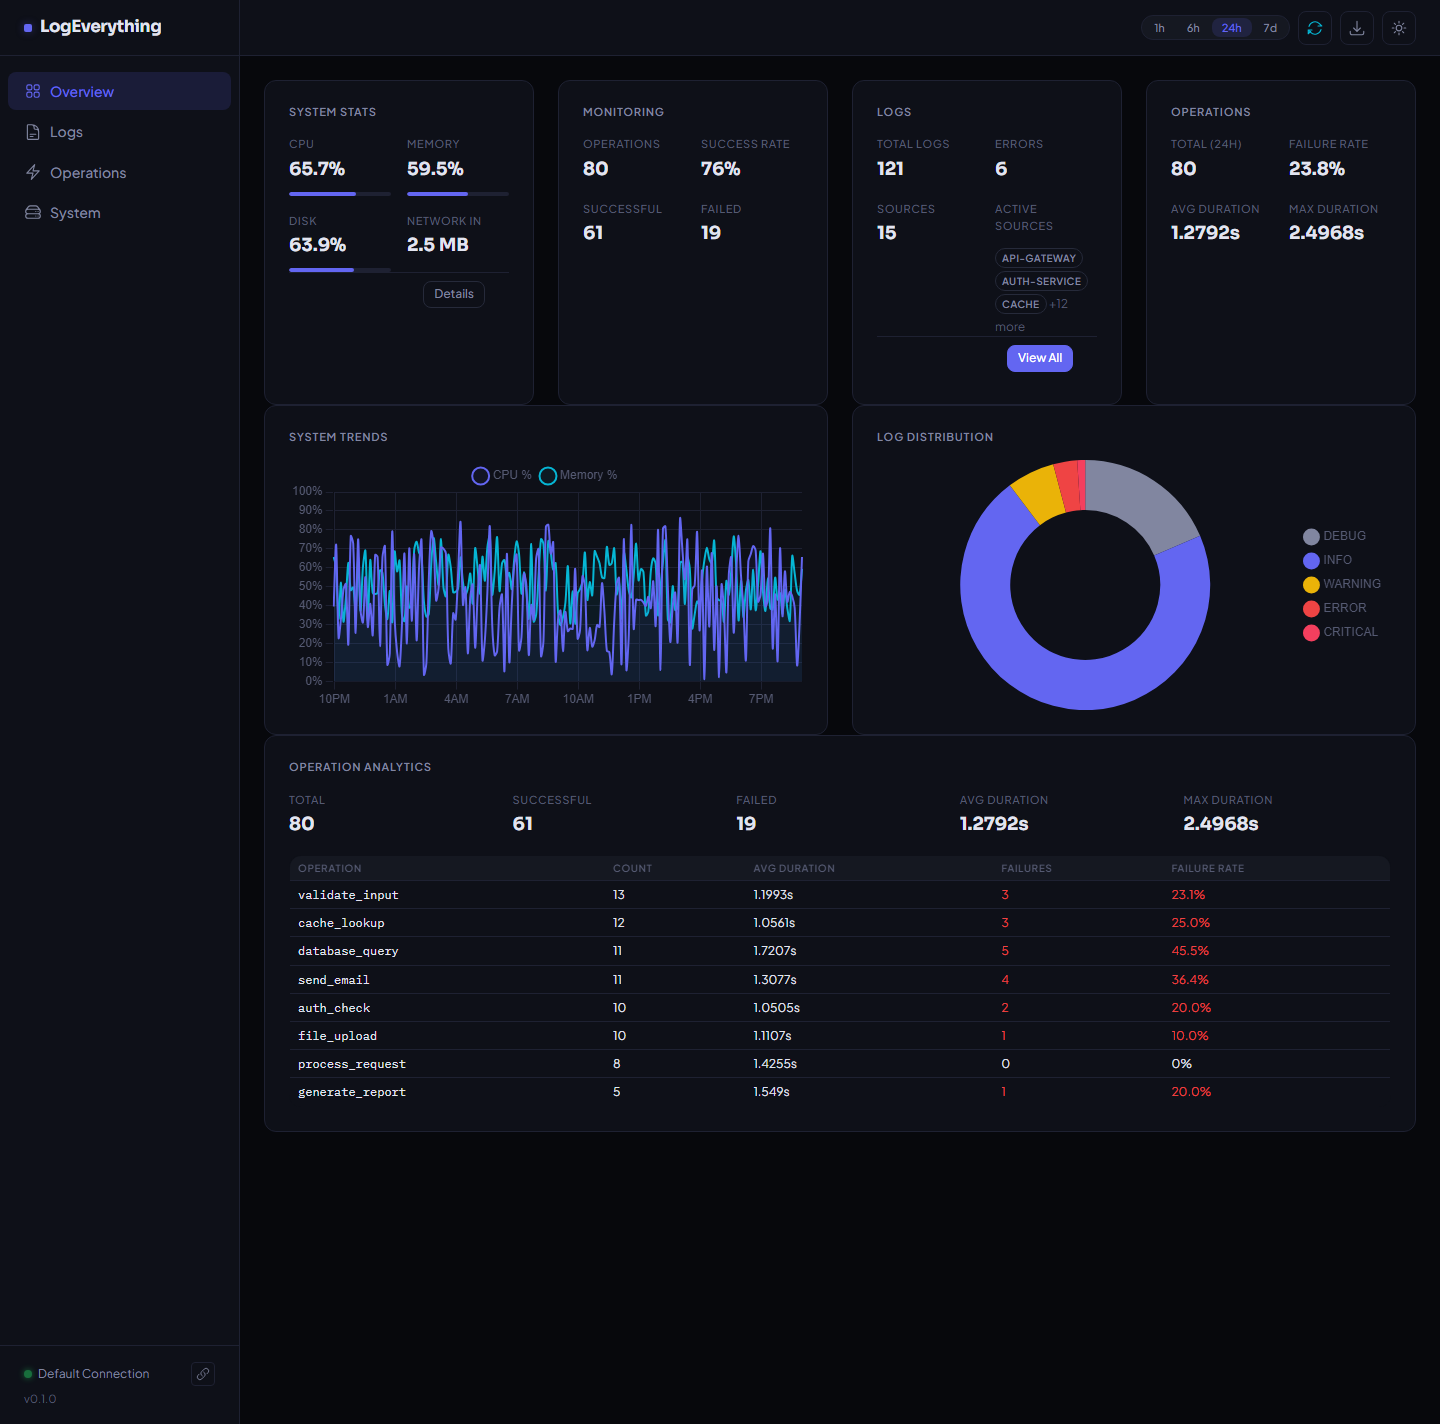
Overview
The landing page gives a high-level snapshot:
Summary cards — System Stats, Monitoring, Logs, Operations (auto-refresh every 10 s).
System Trends — CPU and Memory time-series chart.
Log Distribution — Doughnut chart by log level.
Operation Analytics — Top operations with counts and failure rates.
Logs
A dedicated page for exploring log entries.
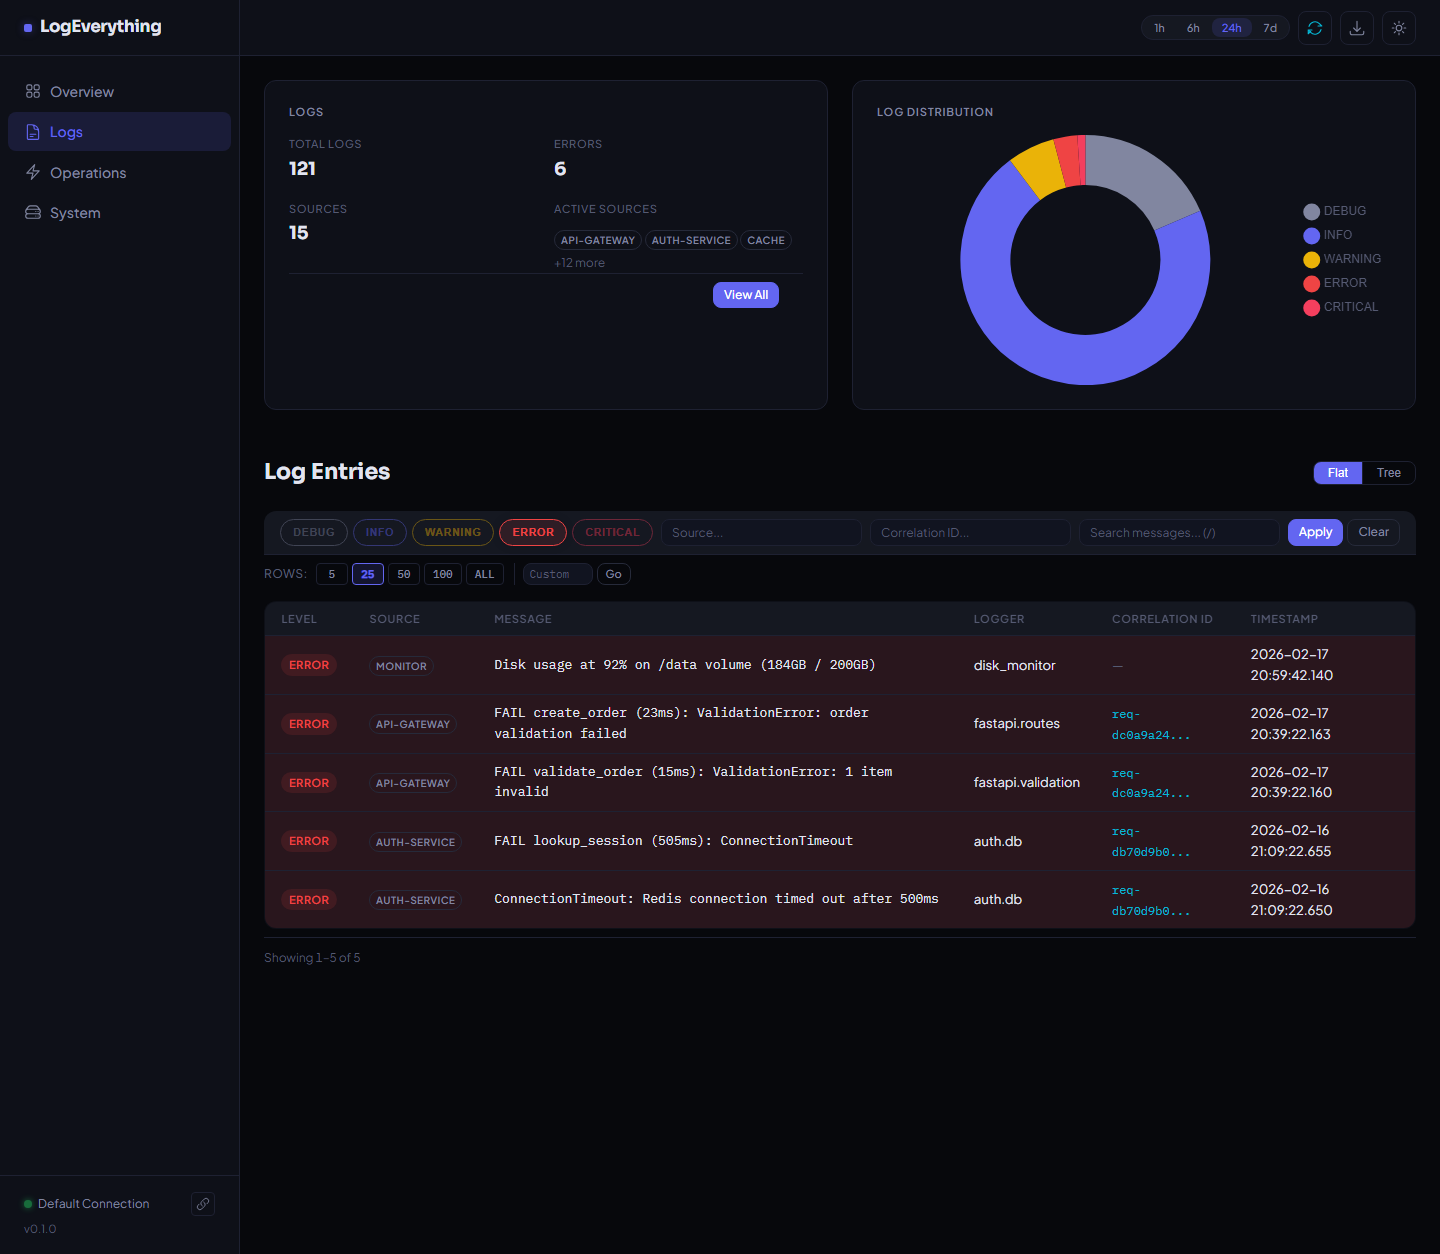
Stats card — Total logs, error count, active sources.
Log Distribution chart — Doughnut chart by level.
Filter bar — Level pills (multi-select), source, correlation ID, full-text message search. Filters are applied with the Apply button and persist across auto-refresh cycles.
Pagination — Choose page size (5 / 25 / 50 / 100 / ALL) or enter a custom value. The footer shows “Showing X–Y of Z” with Prev / Next navigation.
View toggle — Switch between Flat (table) and Tree (hierarchical) views.
Operations
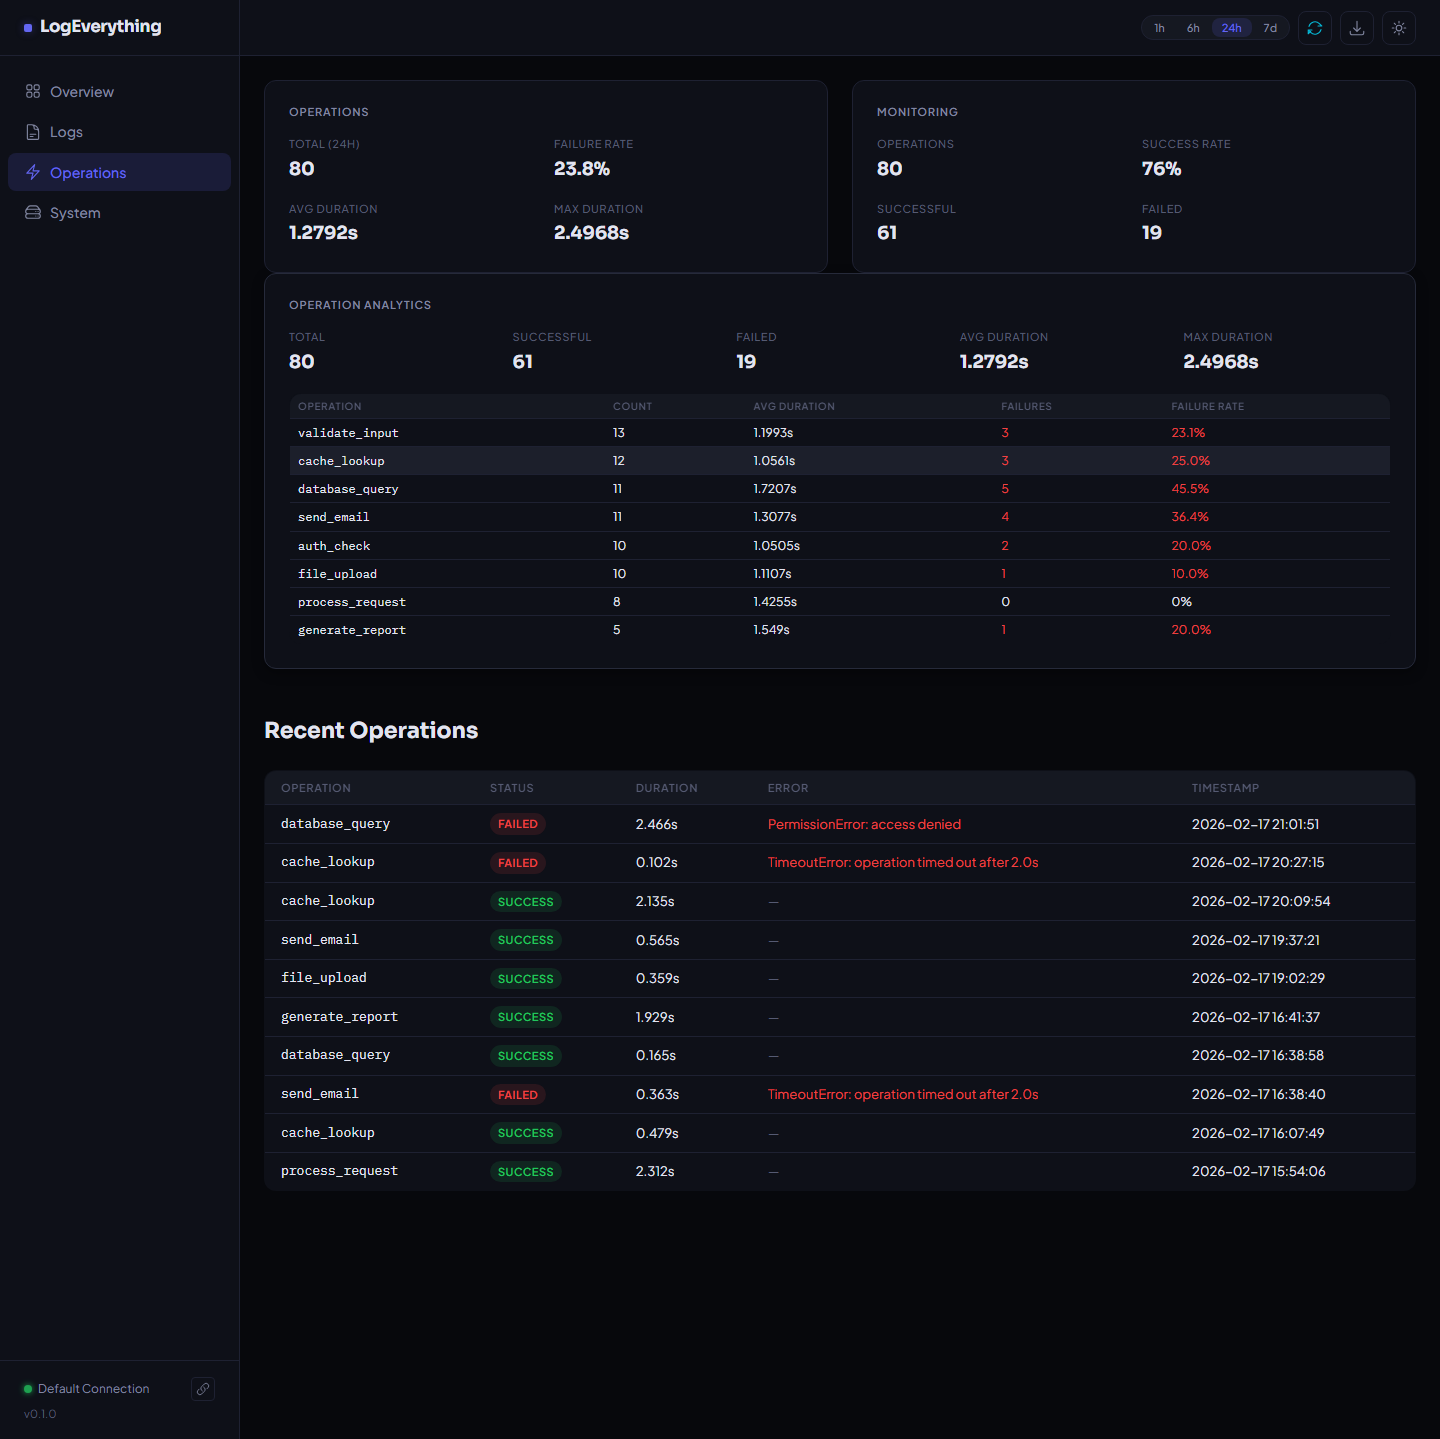
Summary cards — Total operations, failure rate, avg/max duration, success rate.
Operation Analytics — Top operations table with failure rates.
Recent Operations — Table with status badges, duration, errors, and timestamps.
System
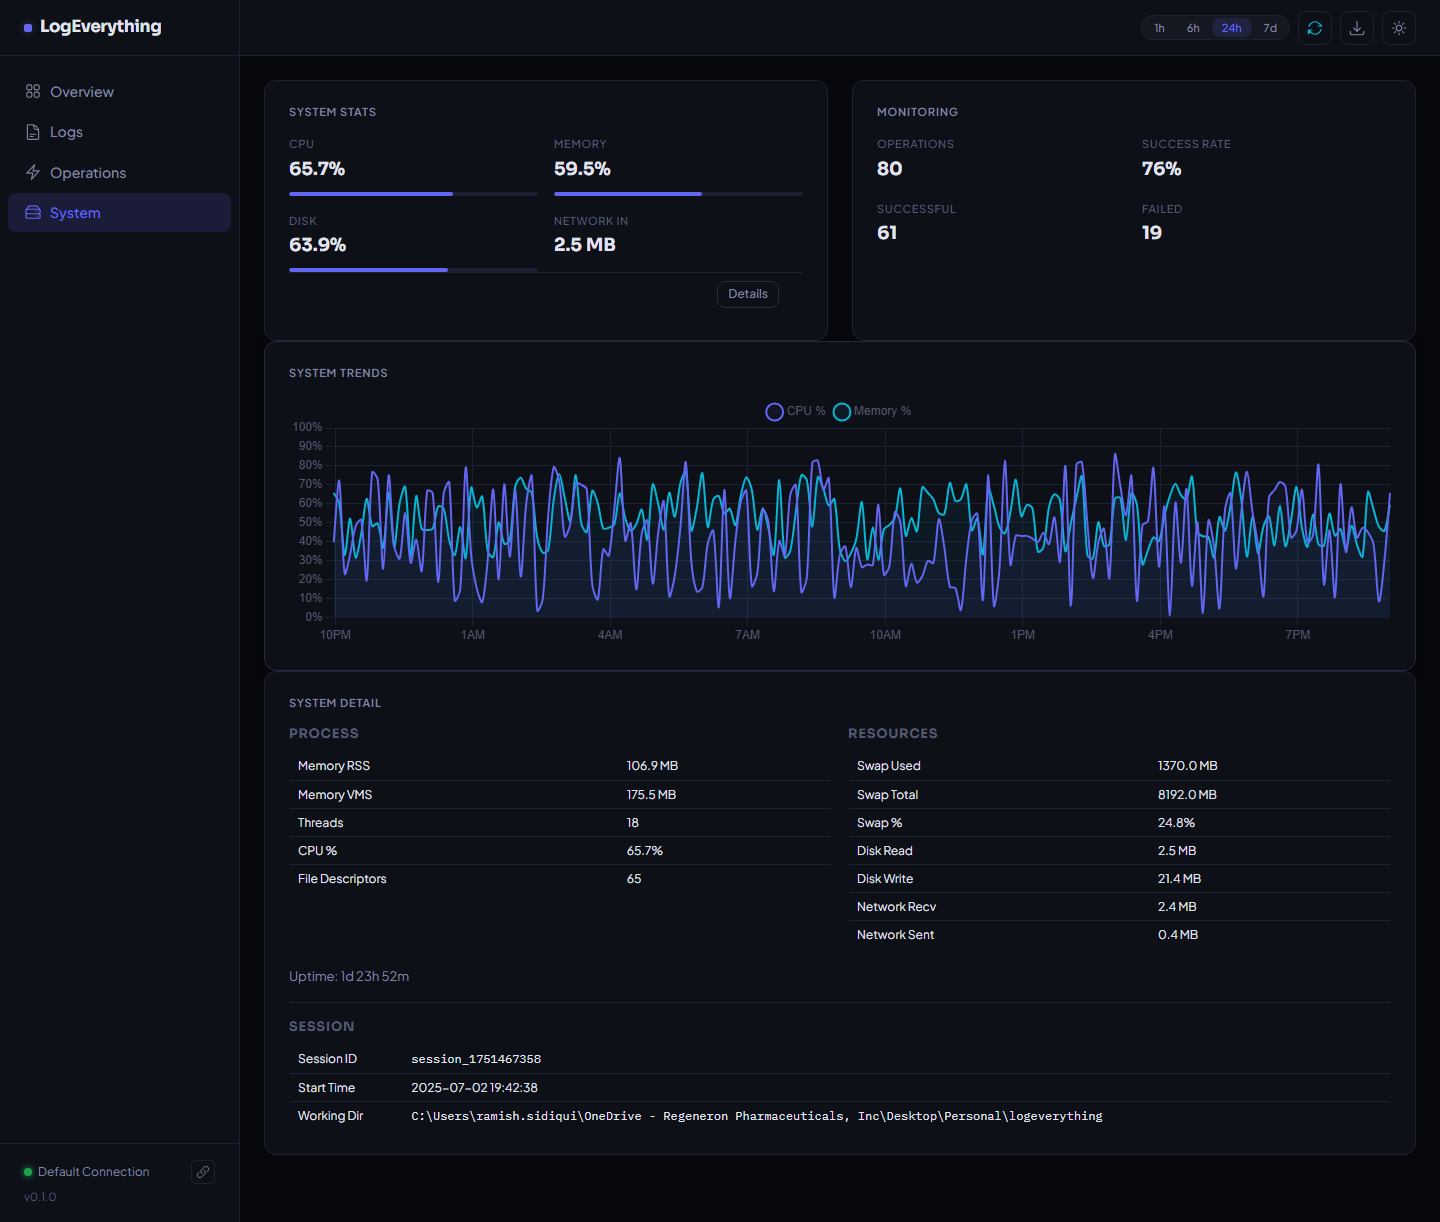
System Stats card — CPU, Memory, Disk, Network.
System Trends chart — Full-width chart for detailed trend analysis.
System Detail — Process metrics (RSS, VMS, threads, CPU, file descriptors) and resource metrics (swap, disk I/O, network I/O).
Session info — Session ID, start time, working directory, uptime.
Tree View
When logs are emitted through LogEverything’s @log decorator with a
JSONHandler or JSONLineFormatter, each record carries structured
hierarchy fields (indent_level, call_id, parent_call_id,
log_type, execution_id). The dashboard reconstructs a collapsible tree
from these fields.
JSONLineFormatter can be attached to any handler — including the rotation
handlers — making it the recommended choice when you need both file rotation
and dashboard integration. See File Rotation for examples.
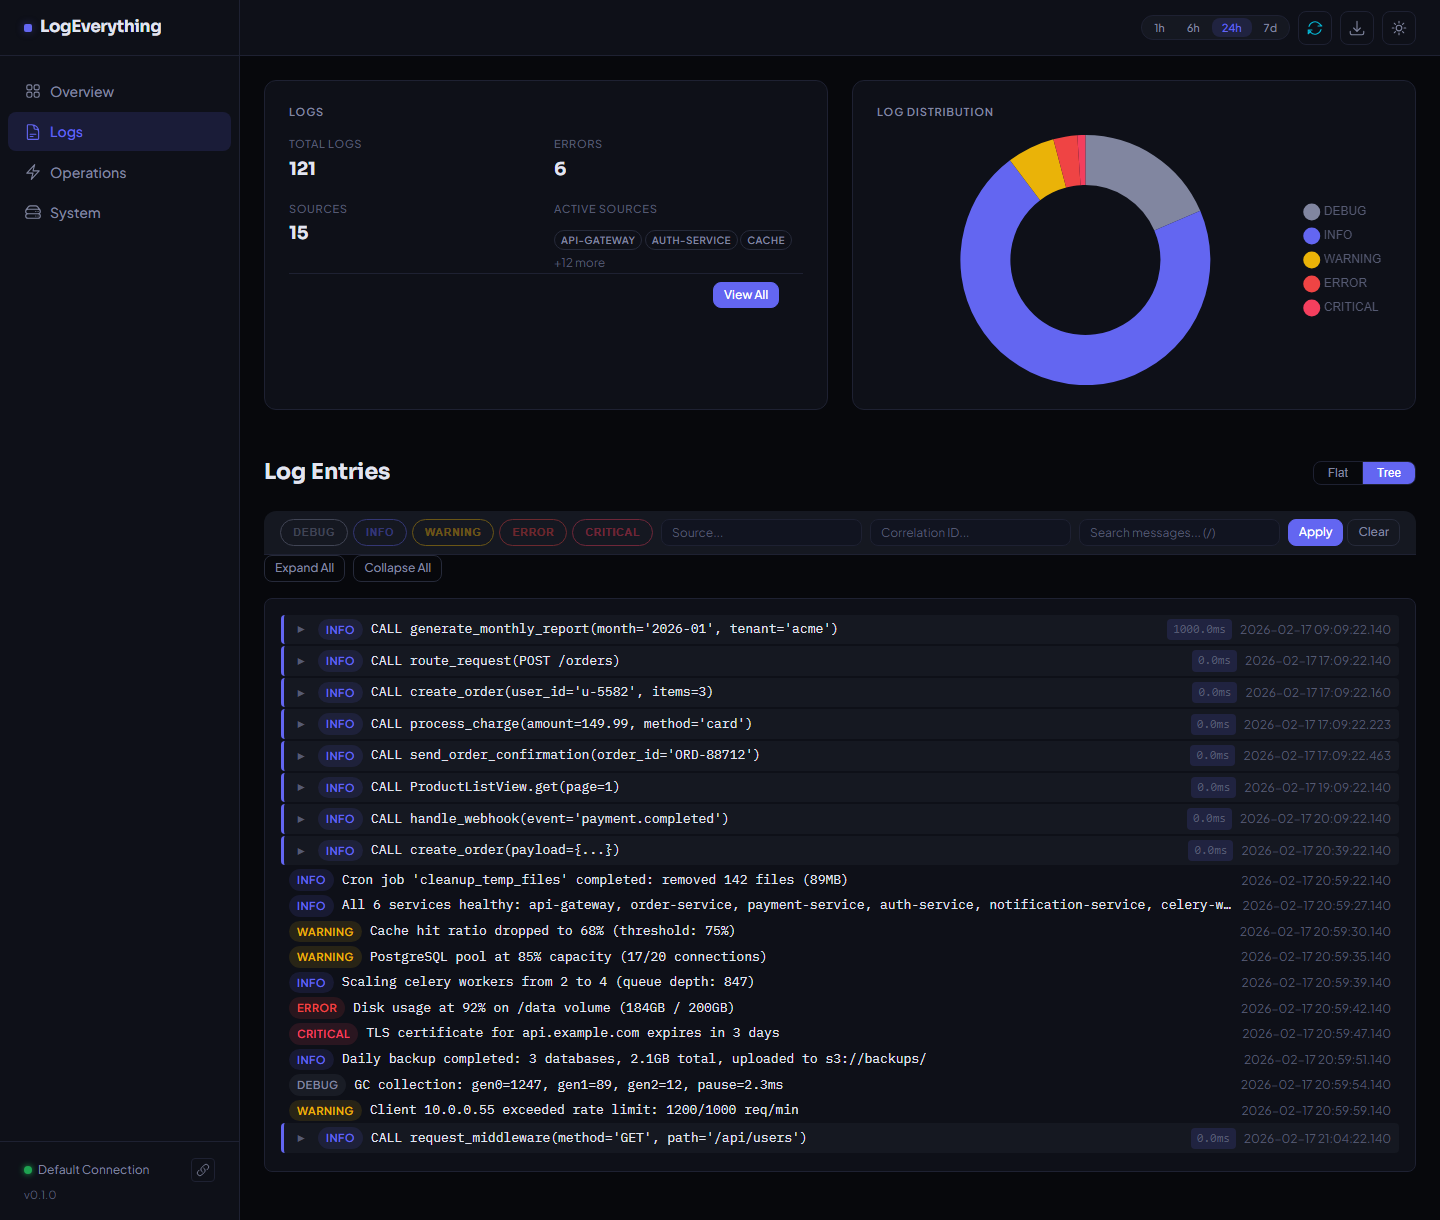
On the Logs page, click Tree to switch views.
Expand / Collapse — Click a function call header to toggle children.
Duration badges — Elapsed time from paired
call_entry/call_exitrecords.Level badges — Colour-coded log level on each node.
Filter-aware — Tree view respects all active filters (level, source, correlation ID, search, time range).
Note
The tree view requires hierarchy fields in the log data. Logs collected
without @log or HierarchyFilter will show a flat list. See
Structured Hierarchy Fields for details.
Filtering & Pagination
Level pills — Click one or more level badges (DEBUG, INFO, WARNING, ERROR, CRITICAL) to toggle them. Active pills are filled with the level colour. Multiple levels can be selected simultaneously.
Text filters — Source, Correlation ID, and Search fields narrow results
further. Press / to focus the search input.
Time range — The header buttons (1 h / 6 h / 24 h / 7 d) filter all pages. The default is 24 h.
Pagination — The ROWS selector above the table lets you choose 5, 25, 50, 100, ALL, or a custom page size. The table footer shows the current range and Prev / Next buttons.
All filters and pagination settings persist across the 10-second auto-refresh cycle. Changing a filter resets to page 1. Filters also apply when the Tree view is active (pagination is hidden in tree mode).
Themes
Click the sun/moon icon to toggle between dark and light themes.
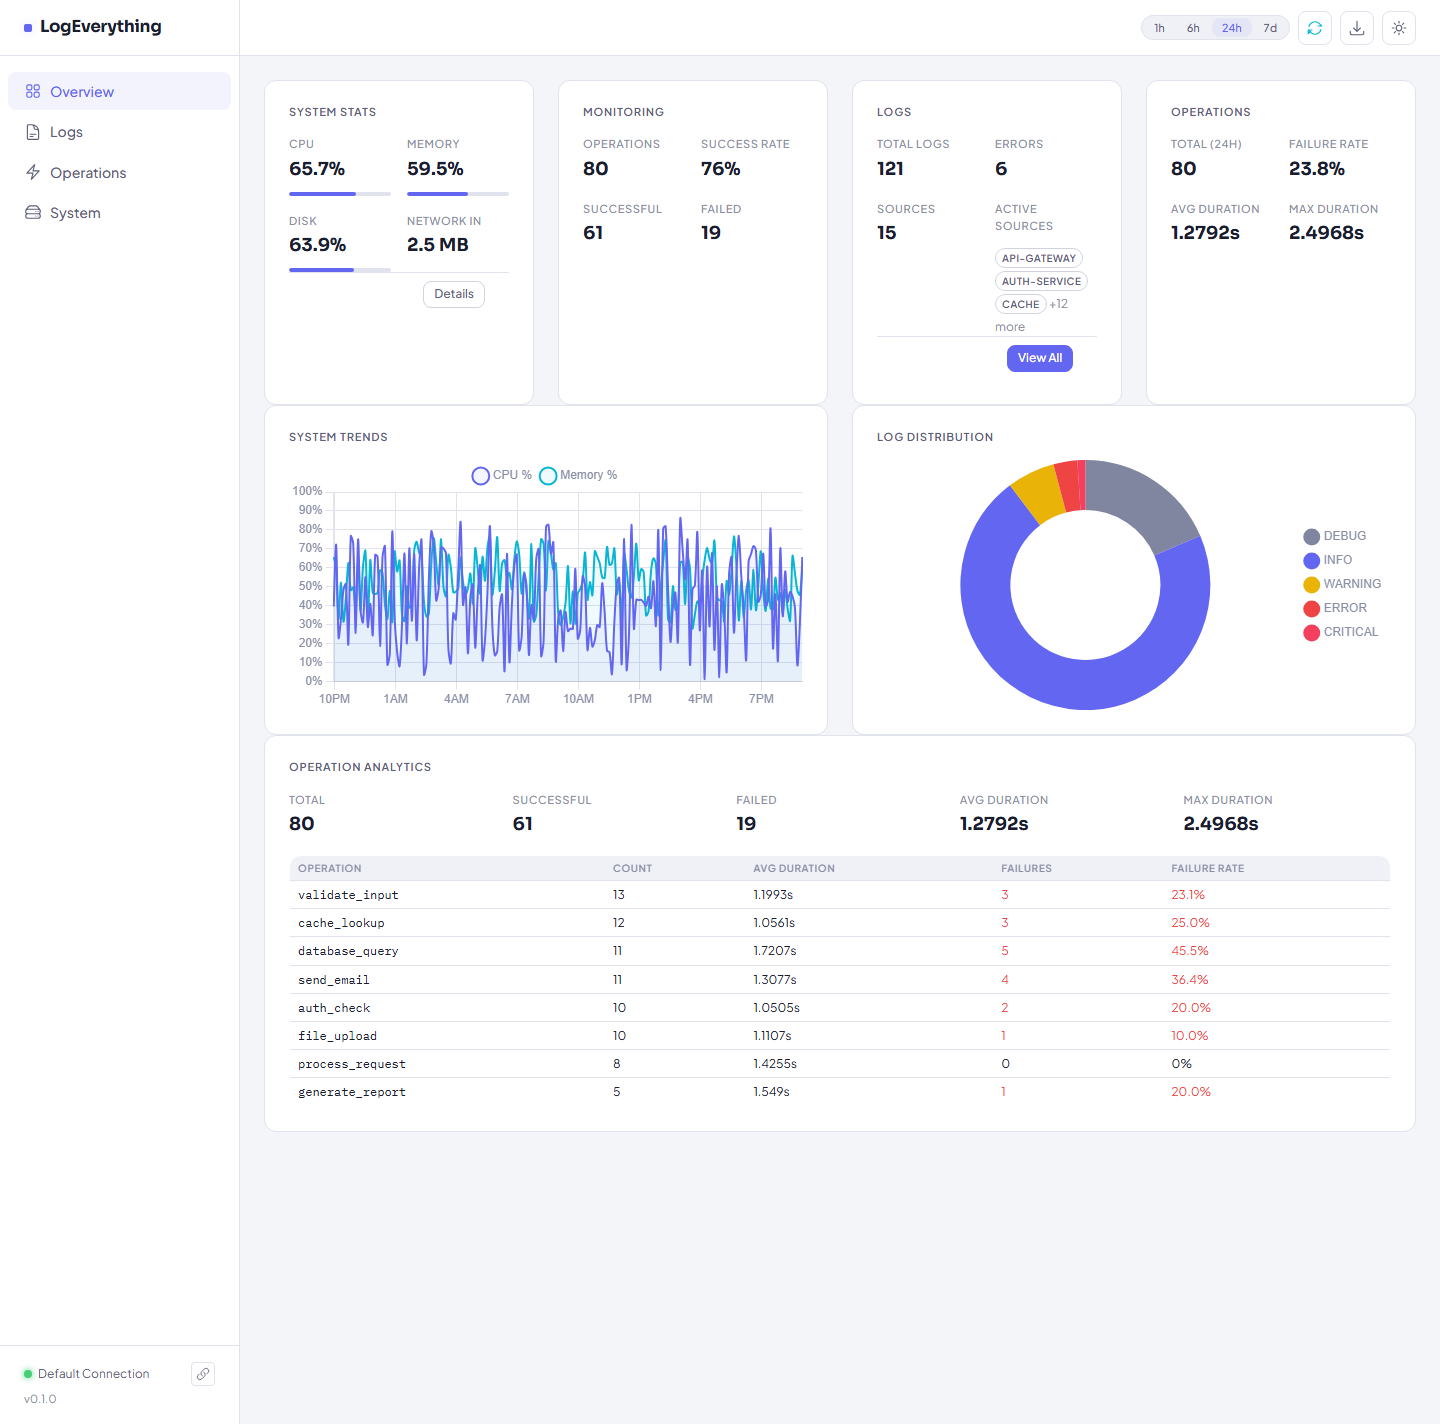
The preference is saved in localStorage. Charts are recreated on theme
change to pick up the new colour tokens.
Keyboard Shortcuts
Key |
Action |
|---|---|
|
Toggle auto-refresh on/off |
|
Focus the log search input |
|
Export data as JSON |
|
Close any open modal |
Auto-Refresh & Export
HTMX partials poll every 10 seconds. Charts refresh every 30 seconds. Click
the refresh icon (or press r) to pause all polling; click again to resume.
Click the download icon (or press e) to export a JSON file containing
system stats, metrics history, operations, logs, and session info for the
selected time range.
API Reference
Page Routes
Route |
Description |
|---|---|
|
Overview |
|
Logs |
|
Operations |
|
System |
HTMX Partials
Route |
Parameters |
|---|---|
|
|
|
|
|
|
|
|
|
|
|
|
|
|
|
|
|
|
|
JSON APIs
Route |
Description |
|---|---|
|
Time-series data ( |
|
Latest system snapshot |
|
Aggregated analytics ( |
|
Log count by level ( |
|
Hierarchical tree JSON ( |
|
Current session metadata |
|
Full data export download ( |
|
Receive batched logs from remote transports |
Customisation
The dashboard uses SCSS compiled to main.css. Source files are in
dashboard/static/scss/:
_variables.scss— Colours, fonts, spacing, radii, transitions.components/— One file per UI component (sidebar, tree, pagination, etc.).themes/—_dark.scssand_light.scssoverride CSS custom properties.
To recompile after edits:
python -m dashboard.compile_scss          # one-shot
python -m dashboard.compile_scss --watch   # continuous
The run_dashboard.py script compiles and watches automatically.